An Introduction to the GEOLOOM co>map, an online, interactive map of Baltimore City that embeds arts and culture data with traditional community indicators by Cara Ober
When one Baltimorean meets another for the first time, the first question asked is always the same.
What neighborhood do you live in?
This question is not idle chitchat or a generic conversation starter. Rather, it is an indicator of one’s cultural, economic, political, physical, and professional identity. Baltimore is a city, first and foremost, of neighborhoods, each with its own personality and flavor, each with unique advantages and many with significant problems.
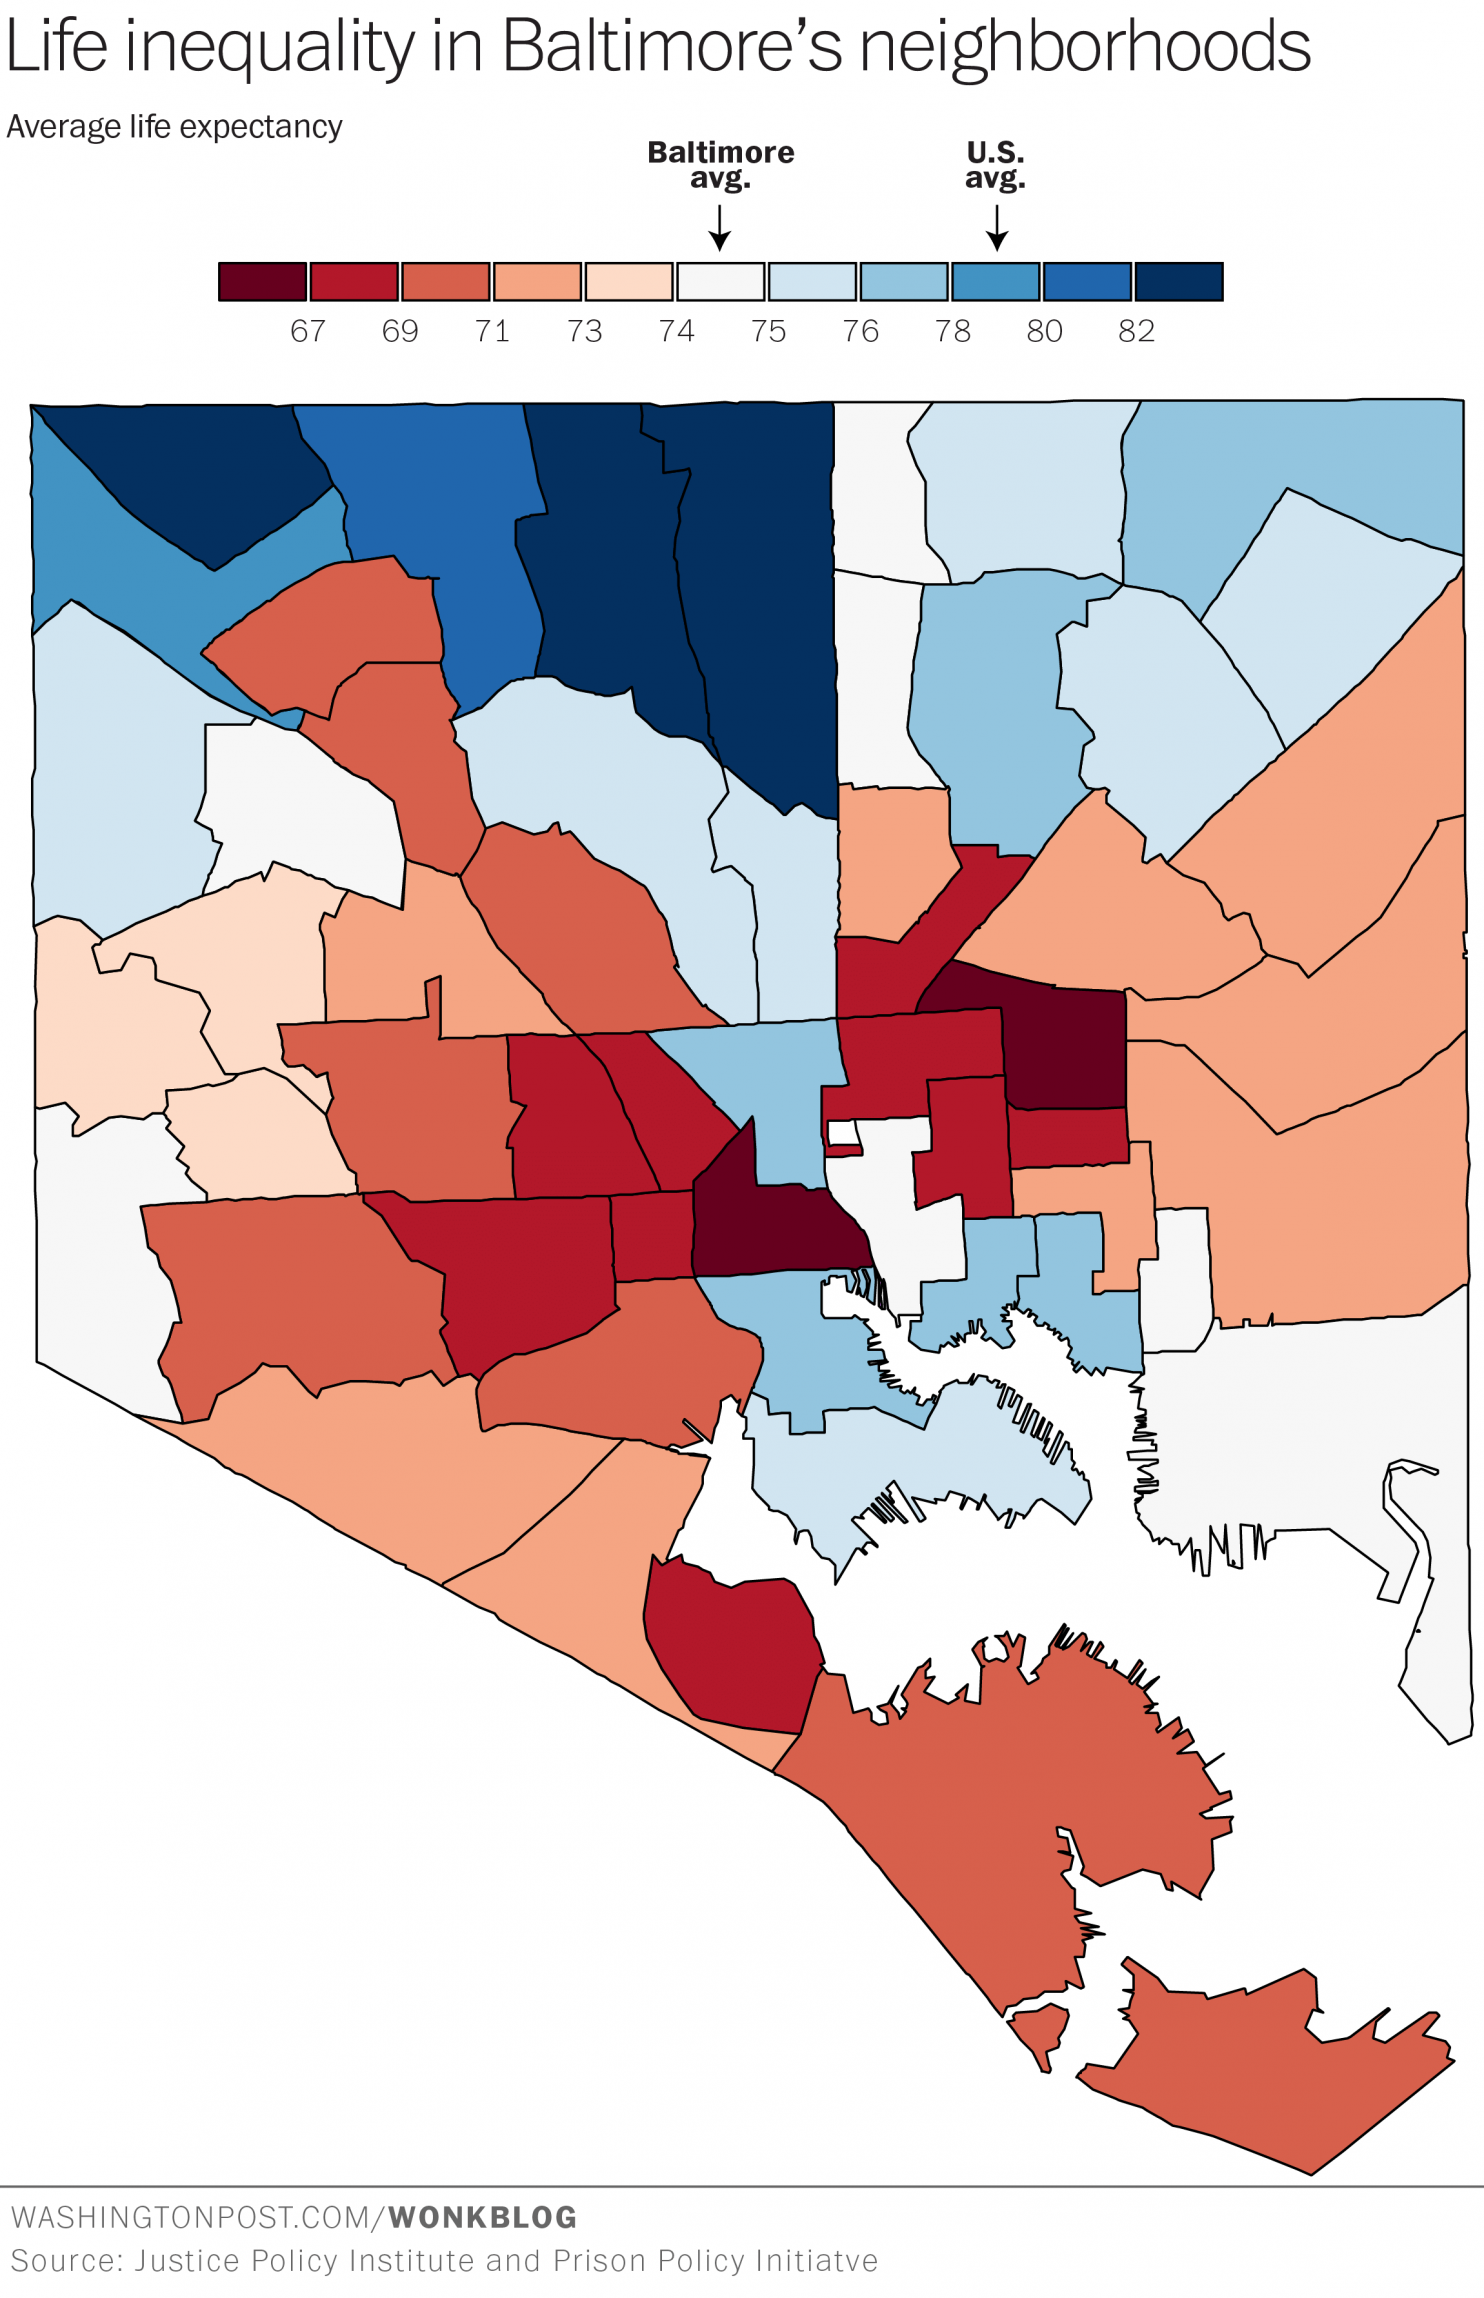
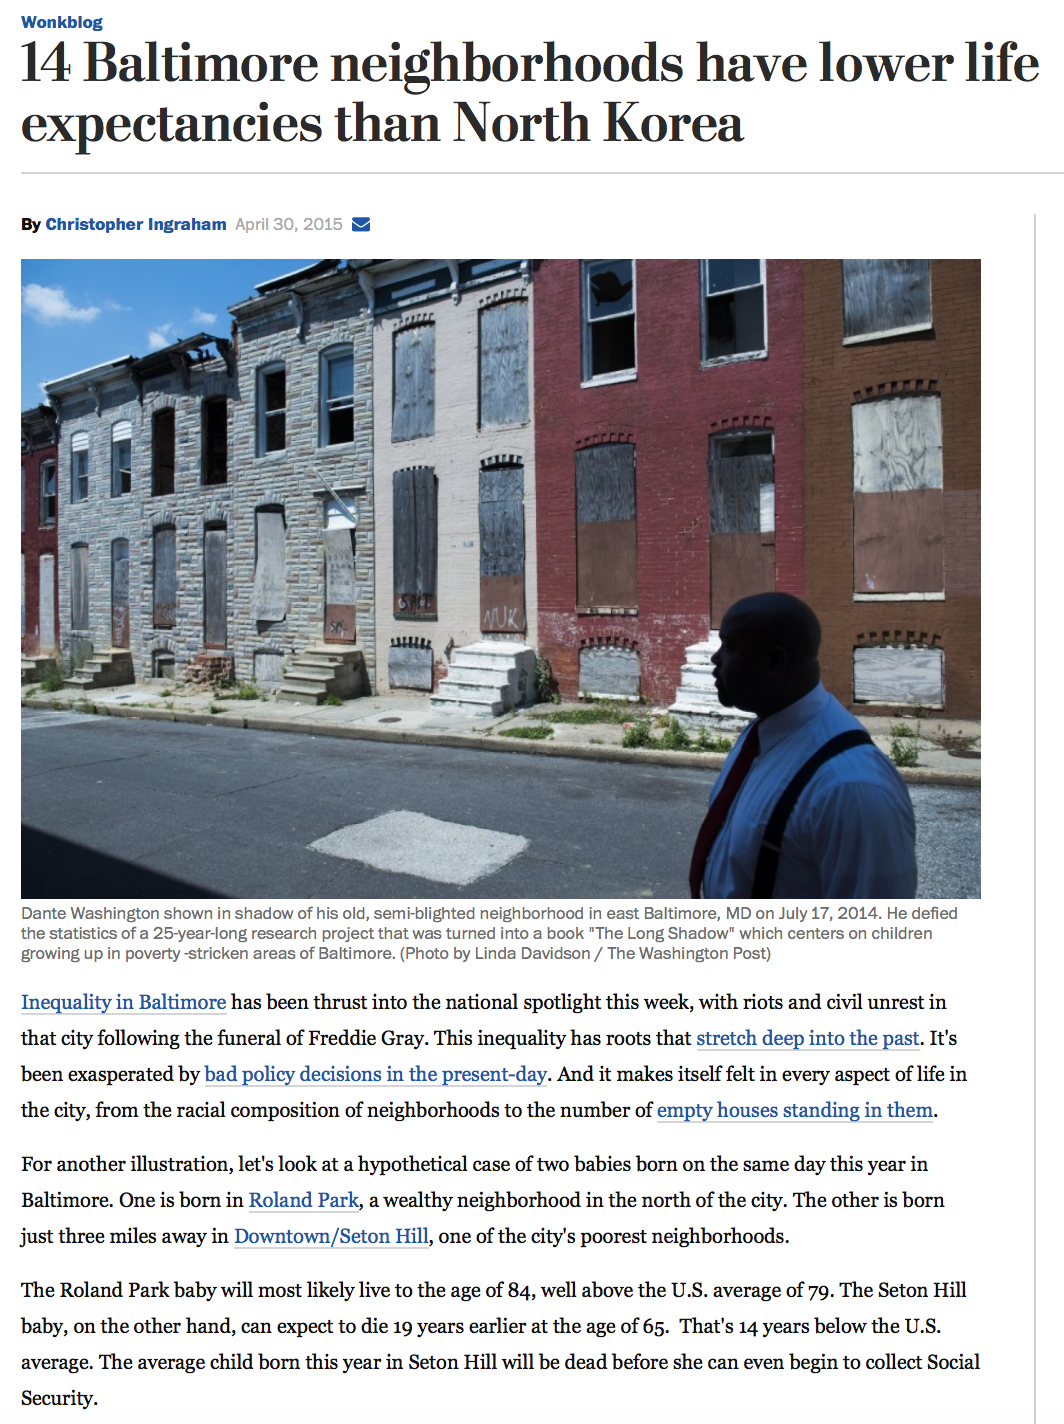
In particular, the economic disparity between Baltimore neighborhoods, despite relative geographical proximity, is beyond shocking, especially when statistical, rather than anecdotal data is analyzed. One case in point is Christopher Ingraham’s Washington Post article from 2015, “14 Baltimore neighborhoods have lower life expectancies than North Korea,” which compared two babies born just three miles apart: one from Roland Park vs. one another from Seton Hill. The Roland Park baby’s life expectancy is 84, well above the US average of 79, while the Seton Hill baby’s life is expected to end 19 years earlier, at 65. The map that Ingraham created for the story helped a city reeling from the death of Freddie Gray to visualize the impact of centuries of systemic racism and inequity. The statistics and the map were a powerful and motivating force.
Since this time, a number of civic leaders, residents, businesses, neighborhood associations, real estate developers, and funders have stepped up their desire to impact real change for Baltimore’s future, to strategically support economic, health, and social healing. Especially because Baltimore City tends to be fractured, it is essential that concerned agents for change combine forces into a coordinated, structured effort to heal this city.
The one piece of this puzzle that has been missing is the hard data, an ongoing source rather than singular entity, to affect change based on reality rather than one’s impressions or from sensationalized news stories.
Baltimore currently hosts armies of ‘do-gooder’ groups marching in and out of its neighborhoods, attempting to help solve existing problems – but how many actually use data to understand the district’s unique problems? Even more importantly, how many of these organizations have been made aware of the organic, community-founded organizations, resources, and structures that already exist which could be supported?
What if the hard data existed for groups to assess each Baltimore neighborhood with equal scrutiny – to build a map, district by district, to communicate the actual needs of each and to properly leverage the community-embedded and community-made resources that already exist?
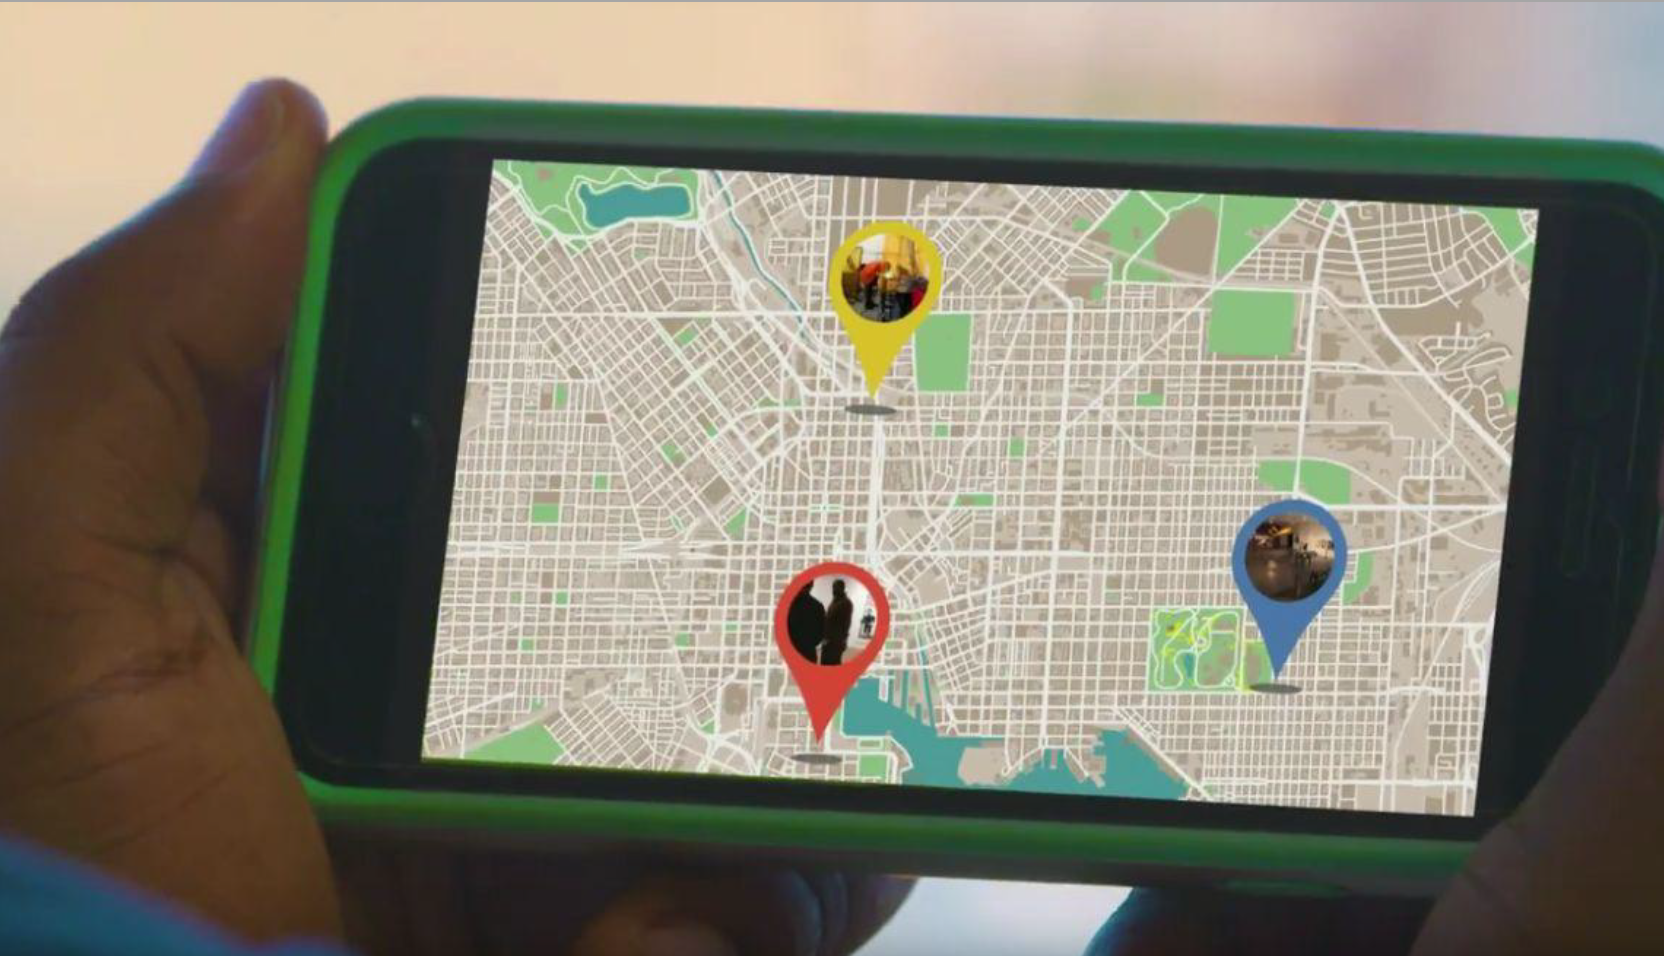
Enter: the GEOLOOM co>map.
On July 14, the Baltimore Neighborhood Indicators Alliance-Jacob France Institute (BNIA-JFI) have announced the launch of the GEOLOOM co>map, an online, interactive map of Baltimore City featuring arts and culture information along with community indicators such as census demographics, children and family health, and crime and safety data. The co in GEOLOOM co>map stands for community, collaboration, and cohesion in Baltimore.
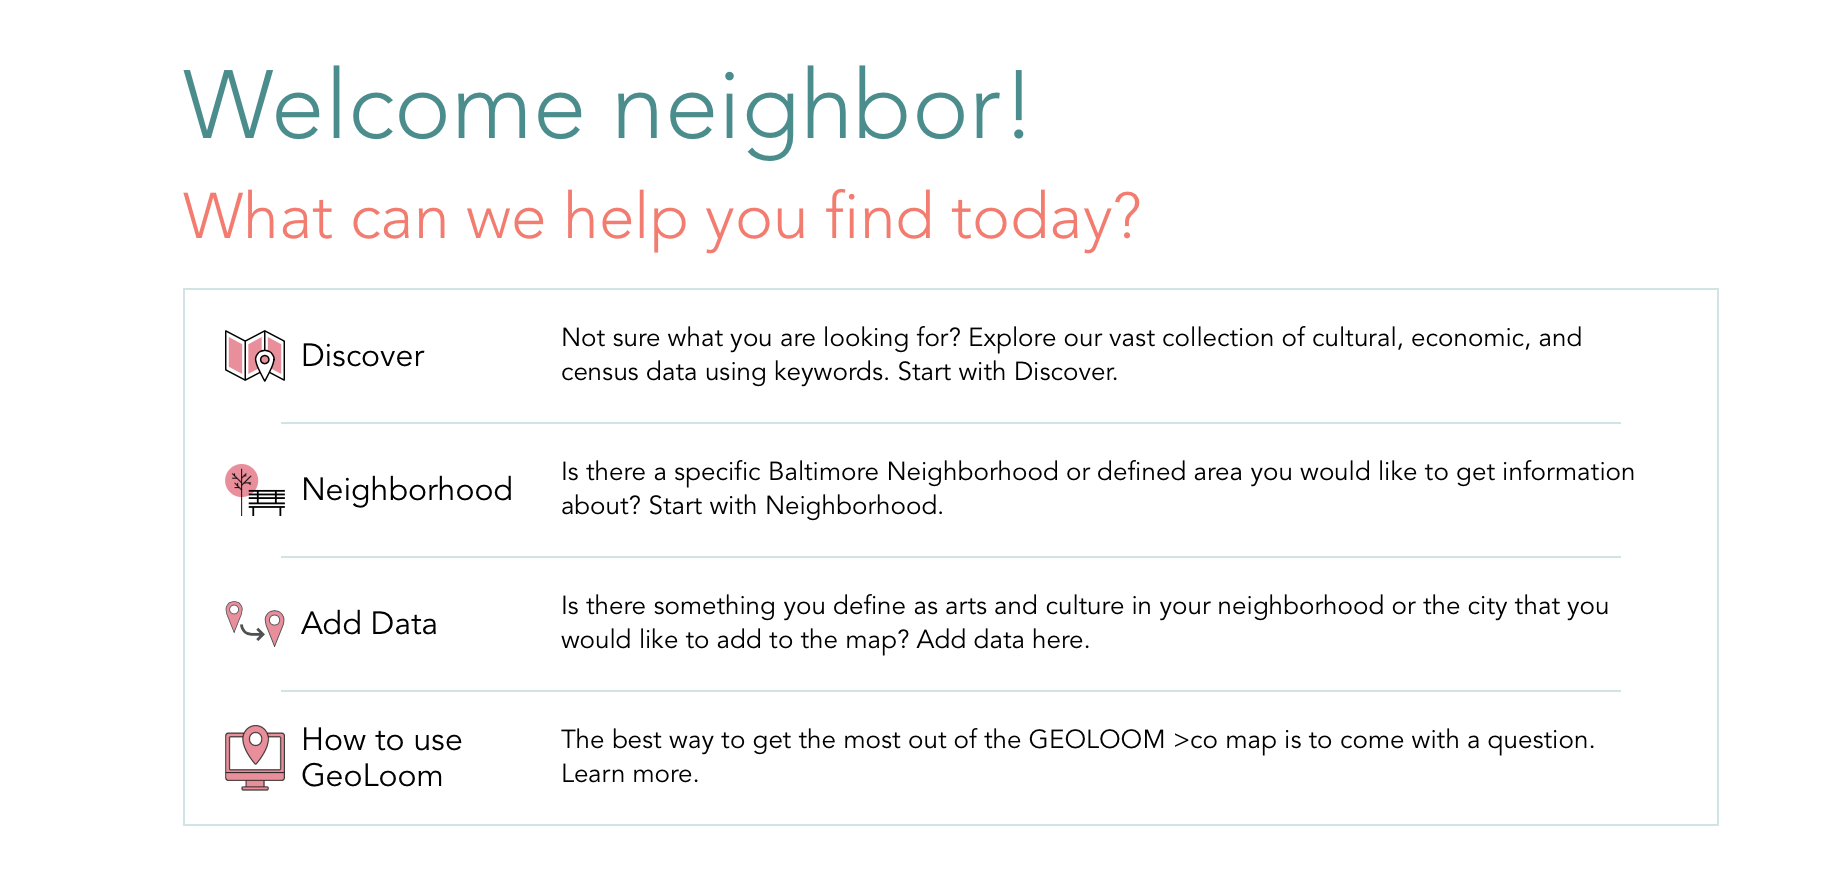
This tool was designed so that our city leaders can make better decisions. This tool was designed so that community members can tell their own stories, both positive and negative, and ask for the resources they need.
So why is it essential to include ‘Arts and Culture’ on a neighborhood map that also includes economic, social, health, and crime statistics?
According to GEOLOOM, which launches today at Baltimore Data Day, this unique tool adds a vital element that is typically missing from equity conversations about Baltimore’s neighborhood. This new map is rooted in the idea that “arts and culture play a significant role in fostering the vitality of a place. Neighborhood-based arts and cultural activity can have an impact on residents’ attachment to their community, the overall economic conditions in their neighborhood, and the quality of life for the entire city.”
In addition, information about existing cultural entities and organizations, as well as individual artists, present opportunities for funders and investors to build upon the success of locally embedded culture producers. Being able to actually see the arts and cultural organizations who have added themselves to this map can create awareness of their strategic value and encourage collaboration and investment.
“We spent most of the time figuring out what people wanted to know about arts and culture in their neighborhood – how to integrate that data from a technical point of view, so that the user doesn’t have to do it,” said Seema Iyer, the Associate Director at the Jacob France Institute, by phone last week. “We also spent a lot of time making sure the design of the site to visualize the data would appeal to everyone, including our most artistic and creative users in Baltimore.”
The project is the result of more than three years of research, listening, and data gathering integrated into the web map. In order to expand on existing data collect by BNIA-JFI—a broad, inclusive, and community-defined range of arts and culture—the GEOLOOM co>map allows for users to add data and continuously seeks new types of information to include on the map.
Being able to actually see the arts and cultural organizations who have added themselves to this map can create awareness of their strategic value and, more importantly, encourage collaboration and investment.
“The real story is the sustainable data collection process,” said Iyer. “Since we are focused on that – the fact that you can see that there is a library next to a school with an art teacher next to a major art institution – how people use that is multifaceted, now that the data is there.”
“Ongoing data collection is critical because things change in neighborhoods over time,” Iyer continued. “This is what BNIA has been doing for a long time. It doesn’t necessarily matter what the data is today – the change in data over time is more important. The minute it comes on the website it becomes old – so the key is adding the new info in, and comparing data over time.”
According to Iyer, “So far, over 95 artists have agreed to be on the site. You can see where they live and where they work – on the map. We have embedded this survey – it’s ongoing – and artists can add themselves, one at a time.” Artists of all disciplines, including visual, literary, film, and dance, can add themselves to the site here.
Participating in the survey and adding yourself to the GEOLOOM map can be helpful both to individuals and communities.
“It’s helpful to see who is an artist in the community,” said Iyer, who has worked to provide data that artists need. “For example, artists wanted to know where maker spaces were so we added that.” Iyer said that, per the request of users, they are looking into adding artist collectives and co-ops to the map, and are continually adding other options.
“The key is for communities who have not yet had access to certain resources to get it,” said Iyer. “Sometimes this is because of a lack of awareness. For example, you might not know that your neighborhood or organization could apply for a Bright StARTS grant, but seeing that the neighborhood next to yours did can encourage you to start building capacity.”
Additionally, the map’s “Add Data” feature allows communities to define and gather recognition around what they value as arts and culture in their neighborhoods.
The GEOLOOM co>map can be used for research, planning, exploration, and investment. It was designed for city planners, artists, civic leaders, residents, large or small businesses, neighborhood associations, arts and culture organizations, non-profit or for-profit real estate developers, private foundations, and government funders. It can help in decision-making about the city’s future.
Through visualization, the GEOLOOM co>map can aid cultural institutions, businesses, and elected officials by heightening their awareness of how arts and culture is integrated in Baltimore’s neighborhoods as well as potential audiences, customers, and constituents.
“From a BNIA perspective, we want to make sure all neighborhoods have info about resources available about them,” explained Iyer. “We want to be able to visualize where things are happening in neighborhoods and to understand demographics and housing stocks. But mostly, we are looking for an explanation of why things are happening or not happening in a neighborhood. Having the data to back it up changes the perception of Baltimore’s neighborhoods.”
For those who want to learn more about using the map and participating in it, free training sessions will start on July 14 at Baltimore Data Day, where two hundred people are expected. Iyer said they will start with groups most likely to use the tool, working with area organizations like the Greater Baltimore Cultural Alliance to train its members.
The data found in the GEOLOOM co>map will be updated regularly to measure community improvements over time, identify gaps, and address arts and culture needs while strengthening all aspects of Baltimore’s social and economic fabric.
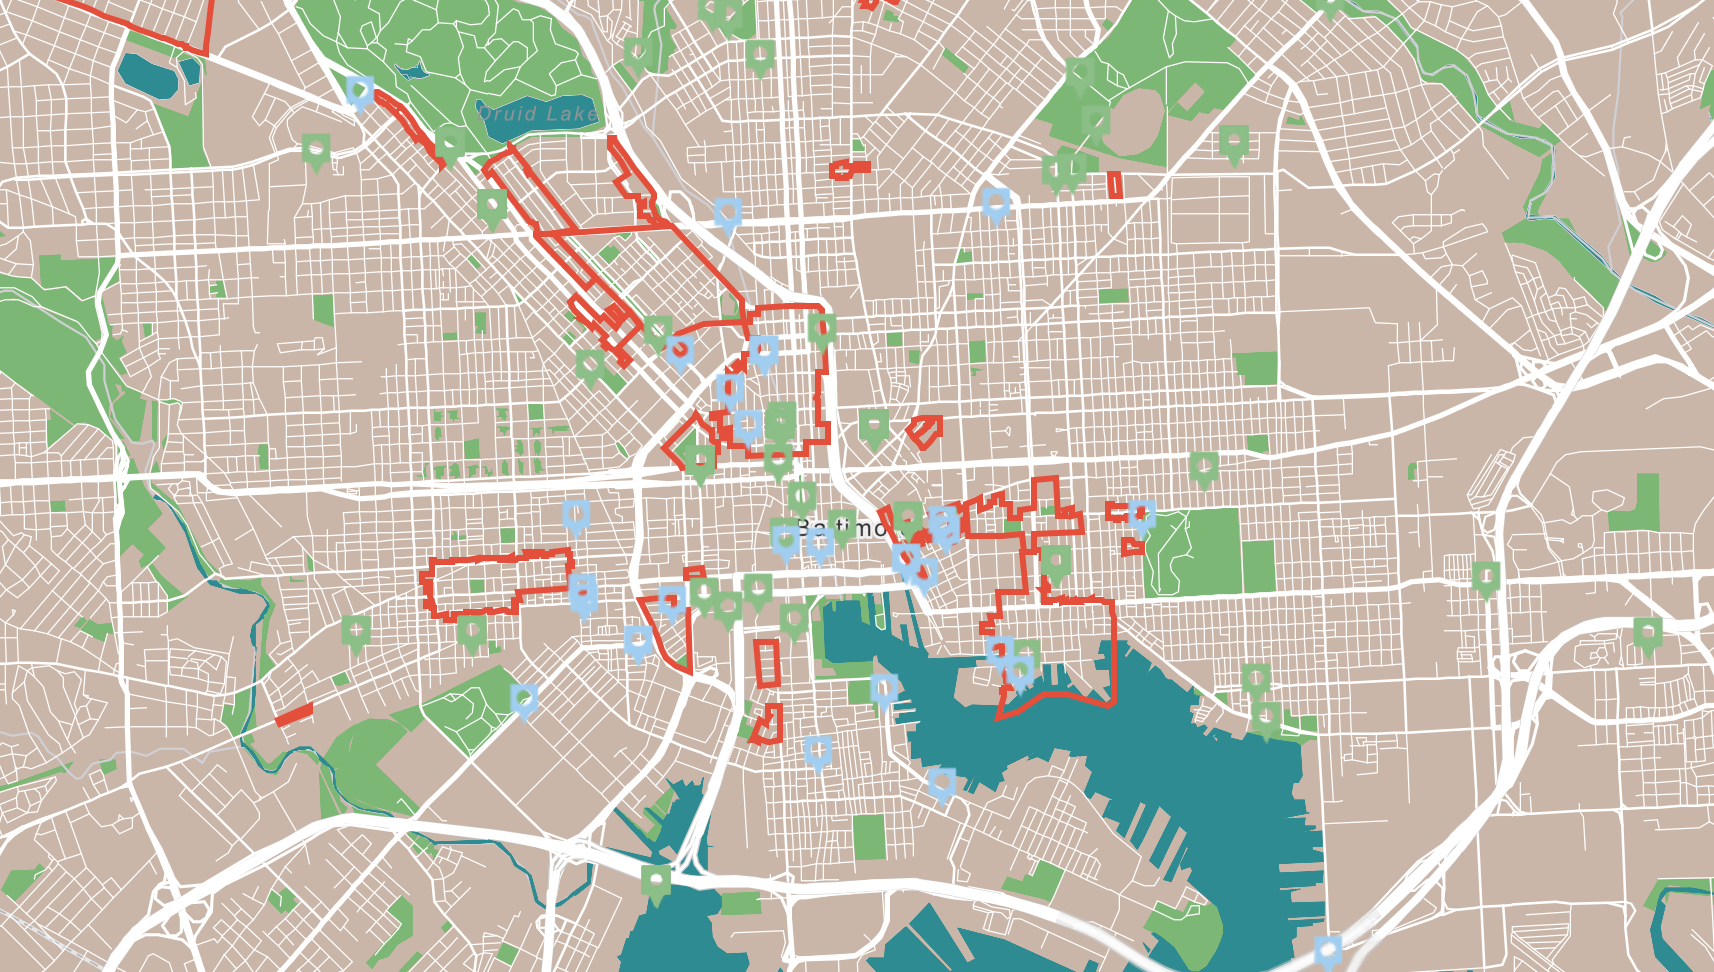
 A current map of Baltimore’s museums, arts districts, and community art spaces.
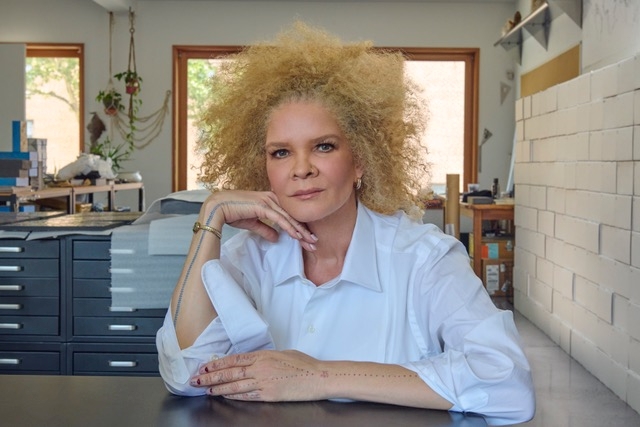
Author Cara Ober is Founding Editor at BmoreArt.
Full disclosure: The Robert W. Deutsch Foundation, a major supporter BmoreArt, has been a key funder of the GEOLOOM project.
More info:
TJ O’Donnell, a professor of assistant professor Klein Family School of Communications Design at UB, served as the project’s designer and Blue Raster, an award winning firm specializing in spatial analysis, application development, and data visualizations, served as the project’s developer. The project was first envisioned by consultant and BOPA Board Member Alyce Myatt, former Director of Media Arts at the National Endowment of the Arts.
The GEOLOOM co>map can be found at http://geoloom.org/. Videos produced by Wide Angle Youth Media showcasing the GEOLOOM co>map can be found on the GEOLOOM co>map YouTube Channel: http://bit.ly/GEOLOOMco_map.
Follow GEOLOOM on Twitter, Facebook, and the Insta for updates!